Archives for Knowledge centre

problems with mains power quality

Concise guide to symptoms and causes of mains power quality problems

To the untrained eye, problems in electrical networks or equipment connected to the circuit may not be recognisable as problems with mains power quality. If there is no obvious identifiable problem, it may be dismissed as “just an old circuit breaker that needs replacing” or “a one-off annoying reset”. You can look at the types of loads on the system and check for harmonics, imbalance or fault patterns.

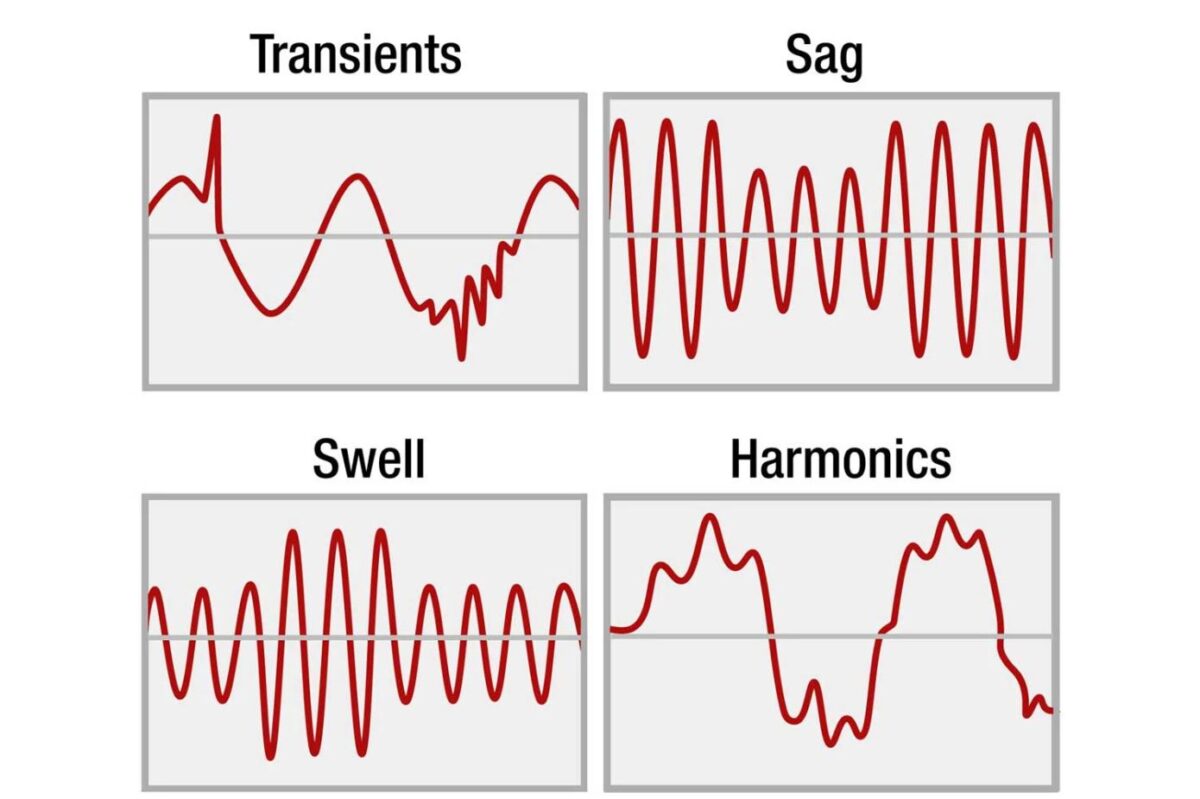
Problems with harmonic distortion and voltage and current anomalies represent the areas where many mains power quality problems occur. Deviations in voltage and current can cause problems, but can often be fixed before they damage equipment. Discover the symptoms:

Ask our experts for advice

Problem

Symptoms

Possible causes

Dips or falls

Dimming of lights, computer crashes, clattering of relays and contactors or complete failure, shutdown of equipment and system
Unjustified and unexplained alarms and stops

Starting large loads, especially large inductive loads
Similar activities in neighbouring facilities
Severe weather

Voltage spikes

Faulty power supply
Overvoltage shutdown and alarms on frequency-controlled drives (VFDs)

Failure in single phase of three-phase system
Sudden decrease in load
Switching between condenser groups

Transients

Effects of flashover and spark discharge in distribution equipment
Damaged insulation
Faulty electronics
Computer crashes

Lightning strikes
Switching capacitors
Restarting systems after a power failure
Sudden downtime of large equipment
Dirty or worn contactors

Interruptions

Shutdown of equipment

Momentary loss of mains power

Imbalance

Overheated three-phase motors and transformers

Unbalanced loads across separate phases of three-phase panels
Unbalanced supply of utilities
Operation of single-phase welders
Open-delta transformers

Harmonischen

Open-delta transformers
Overheated transformers
Overheated inductive motors
Unjustified and unexplained alarms and stops of electronic equipment

Non-linear loads such as switching power supplies
Inverter sections of uninterruptible power supply (UPS), VFDs and battery chargers
Welders
Electric arc furnaces

Power Quality Analyzers and loggers

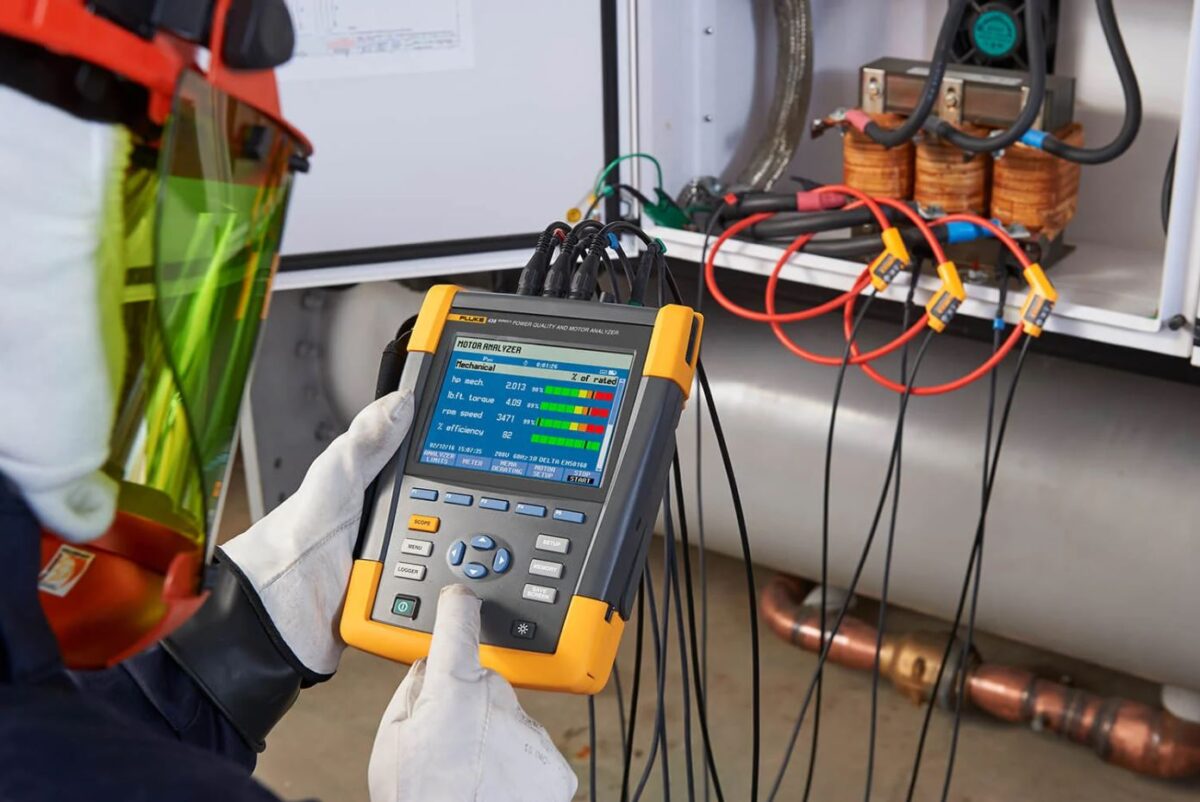
Power Quality Analyzer  can help identify these common power quality problems. With a Power Quality Analyzer, you will never miss another crucial power quality event. Whether you are performing a quick system check or a detailed power quality analysis, consistent data is essential. By connecting the 1770 Series to your assets, the instrument provides a unique automatic measurement system that ensures you collect the right data every time - from fast transients up to 8 kV, harmonics up to 30 kHz, dips and spikes, to the voltage, current and power measurements that allow you to characterise problems in your electrical system.

Power Quality Loggers make it easy to profile energy consumption in your installation. They provide data on current measurements, allowing you to detect and mitigate sources of electrical energy waste or overloaded circuits. These tools are great to have on hand for routine load studies and preventive maintenance programmes.

Power Quality Recorders are the right tool for advanced power quality analysis. Unravel the root cause of equipment failures with load studies and transient analysis, so you can go back later and make necessary repairs or develop baseline data for routine load studies.

Read more
Efficiency and reliability of electric motors

Efficiency and reliability of electric motors: New test conditions match real operating conditions

Electric motors are the most important component in many industrial processes. They can account for as much as 70% of the total energy consumption in an industrial plant, and they consume up to 46% of all electricity generated worldwide. Given their critical nature for industrial processes, the cost of downtime due to faulty motors can amount to tens of thousands of euros per hour. Ensuring efficiency and reliability of electric motors, is one of the most important tasks maintenance technicians and engineers face on a daily basis.

The efficient use of electricity is not merely ‘pleasant’. In many situations, energy efficiency can mean the difference between profitability and financial losses. And since motors consume a significant proportion of energy in the industrial sector, they have become the main target for achieving savings and maintaining profitability. In addition, the quest for cost savings and efficiency improvements and the reduction of dependence on natural resources has led many companies to adopt industry standards such as ISO 50001. The ISO 50001 standard provides a framework and conditions for establishing, implementing and maintaining an energy management system to achieve sustainable savings.

Traditional test methods for electric motors

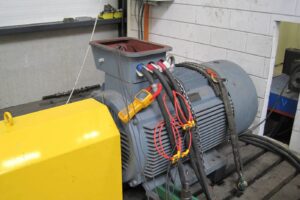
The traditional method of measuring electric motor performance and efficiency is well-defined, but the process can be expensive to set up and difficult to apply in work processes. In fact, checking motor performance very often even requires shutting down the entire system, which can lead to costly downtime. To measure the efficiency of electric motors, both electrical input power and mechanical output power must be determined over a wide range of dynamic operating conditions. According to the traditional method of measuring motor performance, technicians must first install the motor in a motor test stand. The test stand consists of the motor to be tested mounted to a generator or a power test bench.

The motor being tested is connected to the load with a shaft. A speed sensor (tachometer) is connected to the shaft as well as a number of torque sensors, which provide data from which mechanical power can be calculated. This system provides data including speed, torque and mechanical power. In some systems, electrical power can also be measured to calculate efficiency.

The return is calculated as follows:

During testing, the load is monitored to determine the efficiency over a range of operating modes. The test setup may seem straightforward, but there are some inherent drawbacks:

  1. The motor must be taken out of service.
  2. The motor load is not truly representative of the load driven by the motor during operation.
  3. During testing, operation must be delayed (leading to downtime) or a replacement motor must be temporarily installed.
  4. Torque sensors are expensive. They have a limited range, so multiple/different sensors may be needed for testing different motors.
  5. An engine test stand suitable for a wide range of engines is expensive and users of this type of test stand are usually specialist engine repair shops or engine development companies.
  6. No account is taken of ‘real’ operating conditions.

Parameters of electric motors

Electric motors are designed for specific load-dependent applications and therefore have different characteristics. These characteristics are classified according to standards of the National Electrical Manufacturers Association or the International Electrotechnical Commission and have a direct effect on the motor's operation and efficiency. Each motor has a nameplate showing the motor's main operating parameters and efficiency data according to NEMA or IEC recommendations. The data on the nameplate can be used to compare the motor's requirements with actual operating conditions. When comparing these values, you may discover, for example, that a motor exceeds the expected speed or torque, which may shorten the motor's life or cause premature motor failure. Other effects such as voltage or current imbalance and harmonics associated with poor mains power quality can also lead to poor motor performance. If any of these conditions occur, the power of the motor - i.e. the expected motor performance - must be reduced, which can lead to process disturbance if insufficient mechanical power is generated. The power reduction is calculated according to the NEMA standard in accordance with the specified data for the motor type. While the NEMA and IEC standards have some differences, they largely follow the same lines.


Schedule a consultation

Real operating conditions

Testing electric motors on a motor test stand usually means testing the motor under the best possible conditions. Conversely, when the motor is operated under real-world conditions, these best operating conditions usually do not exist. These differences in operating conditions all contribute to the deterioration of engine performance. For example, within an industrial plant, loads may be installed that directly affect the mains power quality, causing system imbalance or possibly harmonic distortion. Any of these conditions can seriously degrade motor performance. In addition, the load driven by the motor may not be optimal or consistent with the motor's original design. The load may be too large for the motor to drive properly, or overloaded due to poor process controls. The load may even be hampered by excessive friction caused by a foreign object blocking a pump or a fan impeller. Recording these anomalies can be difficult and very time-consuming, making effective troubleshooting problematic.

A new approach

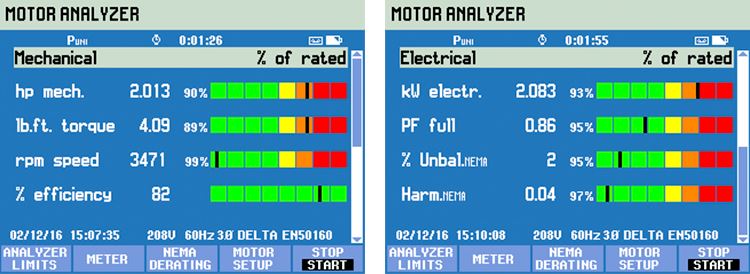
The Fluke 438-IIanalyser for mains power quality and motors provides a streamlined and cost-effective method for testing motor efficiency, eliminates the need for external mechanical sensors and avoids costly downtime. Based on the Fluke 430-II series of mains power quality and energy analysers, the Fluke 438-II has the full functionality for measuring mains power quality while also measuring mechanical parameters for direct-coupled electric motors. Using data on the motor nameplate (either NEMA or IEC data) combined with three-phase power measurements, the 438-II calculates real-time motor performance data such as speed, torque, mechanical power and efficiency, without the need for additional torque and speed sensors. The 438-II also directly calculates the reduction factor of the motor during operation.

The data required by the Fluke 438-II to perform this measurement is entered by the technician or mechanic and includes rated power in kW or hp, rated voltage and current, rated frequency, rated cos φ or power factor, rated duty factor and motor design type of NEMA or IEC classes.

How it works

The Fluke 438-II is capable of mechanical measurements (motor speed, load, torque and efficiency) by applying proprietary algorithms to electrical wave signals. The algorithms combine a mix of physics- and data-driven models of an induction motor, without requiring any of the pre-measurement tests usually required to estimate motor model parameters such as stator resistance. Motor speed can be estimated from the harmonics in the current waveforms produced by the rotor slots. Motor shaft torque can be related to voltages, currents and slip of the induction motor through known but complex physical relationships. Electrical power is measured using the waveforms of the input current and voltage. After estimating torque and speed, mechanical power (or load) is calculated by torque times speed. Motor efficiency is calculated by dividing the estimated mechanical power by the measured electrical power. Fluke has conducted extensive tests on instrumented motors driving power test benches. Actual electrical power, motor shaft torque and motor speed were measured and compared with the values reported by the 438-II to determine accuracy levels.

Overview

While traditional methods for measuring the performance and efficiency of electric motors are well defined, they are not necessarily widely used. This is largely due to the cost because of the downtime involved in shutting down motors, and sometimes entire systems, for testing purposes. The Fluke 438-II provides extremely useful information that has previously been extremely difficult and expensive to obtain. In addition, the Fluke 438-II are advanced mains power quality analysis functions to measure mains power quality while the system is in full operation. Critical motor efficiency measurements are simplified by eliminating the need for external torque sensors and separate speed sensors. This allows the performance of most industrial electric motor-driven processes to be analysed while in operation. This allows technicians to reduce downtime and identify motor performance trends over time, giving them a better picture of the overall condition and performance of the system. By recording trends in performance, changes that may indicate impending motor failures can be identified and replacement is possible before these failures occur.

Read more
Industrial energy waste

Detecting industrial energy waste

Industrial energy wasteDetecting industrial energy waste is a two-part story. On the one hand, there is intention and, on the other, there is strategy. Industrial facilities in the United States continue to express interest in energy management. This is the intention: reduce overall energy use or maintain this use at a certain level, but in the process produce more per kW consumed.


Ask our experts for advice

Then there is strategy. And this is where the shoe can sometimes wriggle.

In a manufacturing environment, a strategy can only work if there is enough knowledge and experience to support the vision, but sufficient ROI must also be realised to ensure that everything is worthwhile. But as for Industrial Energy Wastage, there is no research institute anywhere where an industrial plant manager can go to determine what is “reasonable” energy consumption in a production facility. So how can one then assess what part of the current energy consumption is reasonable and what part is wasteful, or what part of that wasteful part provides enough efficiency to justify intervention?

The return we are talking about here includes the cost per kWh charged by the power company. The rates of these vary, depending on the time of day and time of year. Reducing these costs also leads to immediate cost savings. The investment consists of the material and labour required to change the energy consumption. The return is the period of time that must pass before the lower energy bill leads to the creation of returns. What remains after the costs have been paid is then the icing on the cake.

If we then look again at the strategy, how can we estimate how much return these interventions are going to generate if there is no industry standard for reasonable energy consumption against which to measure it?

Profiling Industrial Energy Waste

Energy consumption in the industry varies and this is due to several factors:

  • the age of the factory
  • the type of load and its format
  • operating schedule, both hours per week and intensity of load
  • the number of employees
  • climate
  • the maintenance philosophy.

The answer to this question is: don't try every kW to manage consumed by your facility. These are the ‘knowledge and experience’ in the equation. Divide the facility by electrical infrastructure and then by key systems.

Energy conservation starts with two basic tactics: (1) general inspection of key systems and (2) targeted data collection, including logging energy consumption at main service inputs and at key load points.

Establish what the specified consumption of a system is and how much the system currently consumes. In addition, establish how much waste is occurring (either in terms of hours and type of use of the system or in terms of equipment and the system itself). To realise the savings, this waste needs to be addressed in the facility, through changes in procedures, maintenance or equipment and controls.
Energy components

Before we start looking at how to be able to track energy consumption, we will take another look at how we define and measure energy.

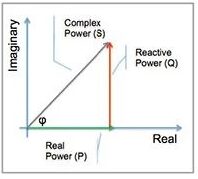
Energy can be expressed in terms of real, reactive and apparent power (Figure 1).

The flow of energy is described as:

  • actual (P) or active power in watts (W)
  • reactive power (Q) in volt-amps reactive (VAr)
  • complex power (S) in volt-amps (VA)
  • apparent power, the size of complex power (VA)

The mathematical relationship between real, reactive and apparent power can be represented by vectors or can be expressed by complex numbers, S = P + jQ (where j is the imaginary unit).

Reactive power does not transfer energy - it does not produce labour - and is thus represented as the imaginary axis of the vector diagram. Real power moves energy, so this is the real axis.

The speed of energy flow in a system depends on the load - is it resistive, reactive or both?

With a purely resistive load, voltage and reverse polarity of current simultaneously, the product of voltage and current is positive at all times and only real power is transferred: labour is produced.

If the load is purely reactive, the voltage and current are out of phase and the product of voltage and current can be positive or negative. This indicates that part of the energy is transferred to the load and part of it flows back. The net transfer of energy to the load is zero: no work is produced.

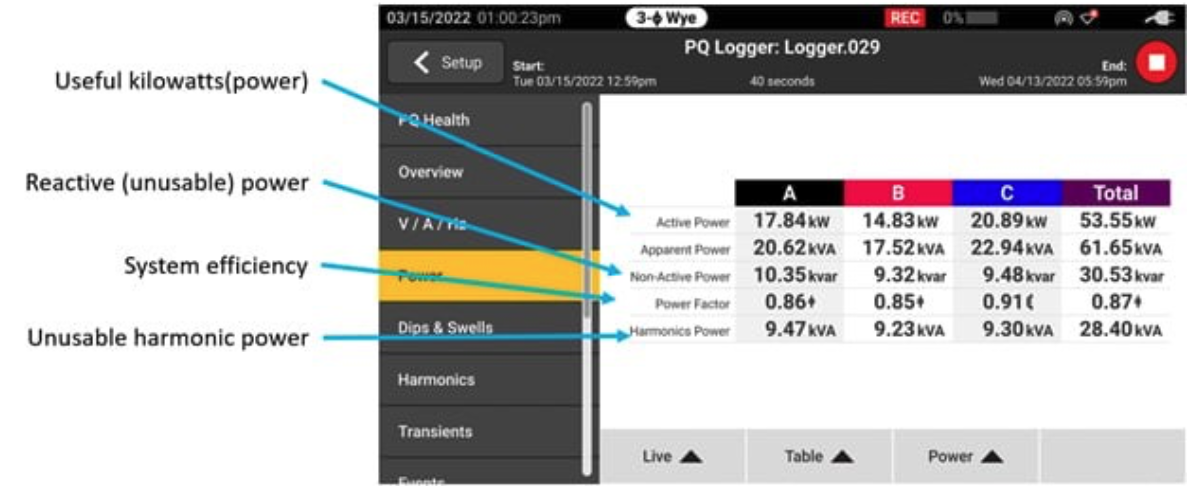
In reality, all loads include a combination of resistance, inductance and capacitance, creating both real and reactive power in a system. Therefore, electrical systems are designed to tolerate a certain amount of reactive power. Problems arise when too much reactive power is generated. Not only is there not enough real power to produce the required labour, but even the system's overall capacity to generate labour is compromised. This is also why utilities fine their customers if their loads produce too much reactive power: it is wasted power because it costs money to generate it, but it cannot be used. Most utility bills count VAr (reactive power) and on many they also calculate the power factor, where the power factor is an indication of how much a system has dropped relative to 100 per cent actual power. Most utilities require their customers to stay above the 0.95 PF (Power Factor) limit.


Schedule a consultation
Monitoring energy consumption

By understanding the basic components of energy, an electrician can equipment for logging energy consumption set to measure the overall level and quality of consumption and then track when energy is consumed and by what.

Log power at main and secondary panels and at large loads. Record kW, kWh and power factor over a representative time period.

This gives you a very accurate picture of the actual energy consumption for three-phase circuits and loads.

You can achieve the biggest energy savings by determining at what times power consumption peaks, evaluating power factor and total power consumption against utility bills, and rebalancing loads if necessary. Even a peak consumption of just a few minutes can increase the utility's tariff for several hours, days or even weeks.

By scheduling the use of taxes differently, a company can take advantage of times when energy is cheaper. See how far below ‘1’ the power factor is and check the power company's bills to see if there are deductions for a bad power factor. If so, the Power Logger can help trace the sources. After making changes in the necessary power areas, reconnect the logger to check that you are indeed benefiting from these efficiency improvements.
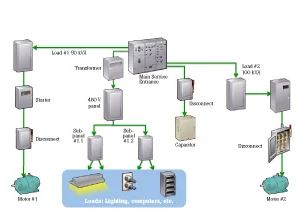
Detecting industrial energy waste

Knowing where energy waste occurs

Every system and process can be a source of waste and this needs to be contained or eliminated. You can already start by scrutinising electrical subsystems, compressed air or steam systems and specific electromechanical systems, but actually every process has potential waste points that need to be measured.

The aim is to map the energy use of specific equipment and processes, to see where energy is wasted so that waste can be quantified. This allows you to prioritise improvements or replacements based on the life of the equipment and see which modifications yield the most return on investment.

Mapping consumption also provides a starting point from which the effectiveness of energy-saving projects can be measured to justify costs.

Common sources of waste in electrical subsystems:

  • Taxes sometimes remain switched on outside working hours or are unnecessarily in operation at the most expensive time of the day.
  • If no regulation is set on the motor, it may mean that more power is generated than needed.
  • Processes with excessive voltage/current cause excessive power consumption to compensate.
  • Phase imbalance causes power to be consumed at load without being able to deploy it.

Identify and quantify:

  • Make a thermal scan of the electrical panel and mechanical load to check for overheating.
  • Log energy consumption over a longer period: how much energy is consumed, at what time and how much waste is involved?

Common waste and inspection points in electromechanical systems:

  • Excessive friction due to misalignment, bearings, imbalance and looseness forces the engine to work too hard, consuming too much power.
  • Uncontrolled loads sometimes remain switched on outside working hours, operate at peak times, generate more power than needed or suffer from overvoltage/current conditions and phase unbalance.
  • Ageing mechanical equipment can use so much more energy than new high-efficiency models that early replacement may be justified by the lower kWh consumption alone.

Identify and quantify:

  • Make a thermal scan of the drive panel and mechanical load to check for overheating. Overheating may indicate electrical inefficiency.
  • Log energy consumption over a longer period: check for total kWh, power factor, peak demand, imbalance and harmonics.
  • Test vibration levels against standards and identify the most appropriate maintenance solutions, such as rebalancing.
  • Perform a thermal scan of couplings/shafts/belts, bearings and fans.
  • Check current and voltage levels.
  • Perform a thermal scan of the termination/connection box and windings and perform an insulation resistance test.

Common waste and inspection points in compressed air systems:

  • Excessive leakage in compressed air lines leads to excessive operation to maintain supply.
  • Compressors that remain switched on outside working hours waste energy.

Identify and quantify:

  • Log energy consumption at the compressor and compare it with base consumption.
  • Measure the pressure at the compressor and at the point of use to determine the pressure drop.
  • Scan pipes with ultrasound to identify leaks.

Common waste and inspection points in steam systems:

  • Defective steam traps and inadequate insulation lead to wasted steam, producing unnecessary steam to maintain the necessary supply.

Identify and quantify:

  • Log energy consumption at the boiler and compare it with base consumption.
  • Perform a thermal scan of pipes and steam traps to identify missing insulation and blockages.


Ask our experts for advice

Making returns transparent

Considering the aforementioned lack of industry standards, how do we really know which systems have the most potential energy yield? Our best source of information at the moment is provided by the examples of common situations. Here are some examples of common industrial systems.

Electromechanical system inspection

Type of facility: Steel recycling plant in Germany
Type of equipment: fan with belt drive, for process cooling
Measurements conducted: vibration measurements
Problems identified: slight imbalance was detected, in addition to misalignment and bearing wear.
Savings realised: Rebalancing was necessary. A 350-kW engine was running at 80 per cent of its rated power; the measured power was about 280 kW. After rebalancing, 3 per cent less energy was consumed. At a tariff of 0.11 euros/kWh, this results in annual savings of 8,094 euros.

Compressed air system inspection

Type of facility: production
Type of equipment: compressed air system
Measurements conducted: test of compressed air system with ultrasound (recommended full compressor data logging)
Problems identified: the amount of compressed air produced compared to actual demand.
Savings realised: Multiple savings opportunities were found. Total annual savings of €50,600. The compressor is switched off on weekends: annual savings of €32,700. Solenoids are installed to turn off the air supply when machines are switched off: annual savings of €7,100. Repair of 36 leaks: annual savings of €4,800. Filters installed in the system at a one-off cost of €6,000; annual savings as a result of these filters: €6,000.

Inspection of steam trap

Type of facility: production
Type of equipment: boilers and steam pipes
Measurements conducted: thermal scanning of steam pipes
Problems identified: six malfunctioning steam traps; steam leakage from coils of a electroplating tank; steam leakage from electroplating pipes: opportunities for condensate recovery
Savings realised: Six malfunctioning steam traps were replaced at a cost of €500 each. Savings realised: €3,200 per steam trap based on known costs, for generating calculations of steam and heat loss. Total savings: €16,200.
Next step: Log energy consumption on the boiler's supply panel before and after addressing leaks and condensate problems.

Higher productivity or lower overhead?

The next question is a fun one to answer: once you have decided which route to take to reduce energy consumption, can you use those savings to increase plant output (produce higher volumes at the same kWh consumption) or for other business strategies (profit margins, price realisation)?

Reducing energy consumption is simply good for business. By logging the consumption of each major system and mapping these costs against energy bills to determine where and when consumption is occurring, companies can often realise savings through simple adjustments to their processes and work schedules. Companies can easily identify which equipment is inefficient and outdated and justify and prioritise replacement. And by reducing overall energy consumption, companies reduce operating costs and improve their market competitiveness.

Tips for cost savings

Adapt business processes to take advantage of:

  • lower energy costs at certain times of the day
  • times when machines can be switched off
  • sensors and controls that allow systems to be switched off when they do not need to be in operation

Set schedules for start-up/shutdown of infrastructure equipment for working hours and for out-of-working hours.

Start appliances with high energy consumption staggered and at least 15 minutes apart to avoid costs due to peak consumption.

Fit variable frequency drives (VFDs) to large motors and replace bad motors with high-efficiency models.

Read more
problems with the PV system

Solving common PV system problems

problems with the PV systemThe number of solar installations across the country is growing faster every year, creating an ever-increasing demand for technicians who know how to efficiently and effectively fix failures of photovoltaic (PV) systems.

PV system troubleshooting usually focuses on four parts of the system: the PV panels, load, inverter and combiner boxes.

The Fluke 393 FC CAT III 1500 V solar clamp meter is the best instrument to use in most areas of a solar installation. This is the world's only CAT III 1500V rated, IP 54 AC/DCa current clamp with features - such as DC voltage, audio polarity and visual continuity - tailored for testing and measuring in solar PV applications.


Ask our experts for advice

1. Troubleshooting the PV system

First check the output of the entire system at the metering system or inverter. Before you start troubleshooting, check and note the input voltage and current level of the array's inverter. You are likely to encounter one of two scenarios:

All or part of the PV system is down or not producing power; this may be related to a problem with the inverter.
Or the output of the PV system is less than expected; this may be related to a problem with one of the arrays or modules.
Trace individual branch wiring backwards from the concentrator. Visually inspect the entire system for obvious damage or inadvertent disconnection. Once you find the faulty module or array, check all wires, switches, fuses and circuit breakers. Replace blown fuses; reset circuit breakers and switches. Check for broken wires and loose or dirty connections; replace and clean if necessary. Watch for loose connections between modules. They may have come loose and caused lack of contact.

The combiner box can be a great place to troubleshoot system problems, as it returns individual wires from the modules to the system. Each module may have a fuse that you need to check with your Fluke 393 FC.

Wiring problems and loose connections can also cause a module to produce too low a voltage. Check all wiring connections. If a module output is low, it could mean that a single cell section is bad. These can be retraced using the 393 FC at the junction boxes until the culprit is found.

The Fluke 393 FC gives an audio polarity warning when you test Voc. If you notice that the polarity is reversed, this could mean that other circuits in the combiner box are inadvertently connected in series, resulting in voltages above the inverter's maximum input voltage.

Dirt or shadow on the modules themselves can cause reduced output. Although the modules are usually designed to be maintenance-free for years, they may need cleaning. Pollen and dust can be a significant problem in some parts of the country.

2. Solving problems with PV loads

The PV system is used to control building electrical loads; any problems with the loads also affect the system. The first step is to check the load switches, fuses and circuit breakers with the Fluke 393 FC to see if the load connection has the correct voltage. Next, use the 393 FC to check the fuses and circuit breakers. If you find blown fuses or tripped circuit breakers, find the cause and fix or replace the faulty component. If the load is a motor, an internal thermal breaker may be tripped or there may be an open winding in the motor. For testing purposes, connect another load and see if it works properly.

As with any electrical system, check for broken wires and loose connections. Clean all dirty connections and replace all bad wiring. If the power is off, then check for earth faults and repair them. If fuses or breakers blow or trip again, there is a short circuit that you need to locate and repair.

If the load still fails, use the Fluke 393 FC to check the system voltage at the load connection. The wire size may be too small and need to be increased. The wires running to the loads may also be too long. This is shown as a low voltage at the load. In this case, reduce the load on the circuit or run a larger wire.


Schedule a consultation

problems with the PV system3. Troubleshooting PV inverters

You probably work with inverters every day, so you are used to checking AC and DC power. The inverter in a PV system can also fail and cause problems. The inverter converts direct current from the PV system into AC mains power for use in buildings.

If the inverter does not produce the correct output, first check and note the working DC input voltage and current level of the inverter. On the AC side, use the Fluke 393 FC to check the inverter's output voltage and current level. Many have a display that shows the performance of the current inverter and the system. Because the 393 FC produces a true-RMS reading, you can use the voltage and current to measure and record the kilowatt (kW) output. If possible, use the inverter display to show the current total kilowatt hours (kWh). You can then write down this value and compare it with the value recorded during the last inspection. On the DC side, you can use the 393 FC to check the DC power supply and store the value in the Fluke Connect™ app on your phone.

If the inverter is not producing the right amount of current, there could be several problems - all of which you can easily check with the Fluke 393 FC:

  • Blown fuse
  • Activated circuit breaker
  • Broken wires

Use the Fluke 393 FC to measure the AC output side of the inverter; the load of the inverter may have an excessive current demand. With the dual display showing AC voltage and frequency, you can determine whether the inverter's AC output is working correctly.

The inverter can be connected to the local utility. The inverter's AC current fluctuates with the level of solar input on the array. The inverter maintains the correct output voltage and phase to the utility. Utility voltage problems may cause the inverter to shut down. In this case, contact the utility company for repairs.

4. Troubleshooting in combination boxes

When troubleshooting combiner boxes, current strength measurements and calculations are crucial to determine whether the PV arrays are working correctly. Measuring current on individual arrays or combining current measurements helps you determine if a cell is not working properly.

The thinner jaw design of the Fluke 393 FC current clamp allows you to get several conductors into the jaw for combined current measurements, even in tight or crowded spaces such as inverters or combiner boxes.

Read more
IEC 61000-4-30 class A

What does the IEC 61000-4-30 Class A standard mean for me?

The IEC 61000-4-30 Class A standard eliminates guesswork when choosing a power quality instrument.

Grid power quality logging, measurement and analysis is still a relatively new and rapidly developing field. Whereas fundamental electrical measurements such as RMS (effective voltage) and current have well-defined measurement parameters, many mains power quality parameters have no such definition. This fact has forced leading manufacturers to develop their own algorithms for measuring these mains power quality properties, resulting in hundreds of unique, global measurement methods.

With so much diversity between instruments, technicians often have to take the time to analyse and understand the capabilities and specific measurement algorithms of the instrument in question, rather than understanding the quality of the power supply itself. Standardising measurement methods allows direct comparison of results from different analysers.

Standard IEC 61000-4-30 Class A defines the measurement methods, collection times, accuracy and evaluation for each mains power quality parameter, to obtain reliable, repeatable and comparable results. In addition, the IEC 62586 standard defines the minimum set of parameters to be implemented for mains power quality instruments used in both portable and fixed installations.

As more manufacturers begin to design instruments for measuring and analysing mains power quality to Class A standards, technicians can be more confident in the measurements they take. All this increases accuracy, reliability, comparability and efficiency at work. The standard is updated periodically as the industry evolves and new measurement scenarios are discovered or required. Since its introduction in 2003, the standard has been updated several times and is currently in edition 3 (2015).

Examples of requirements according to class A
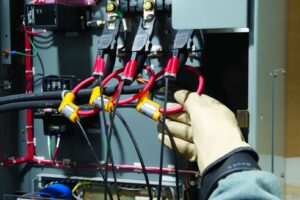
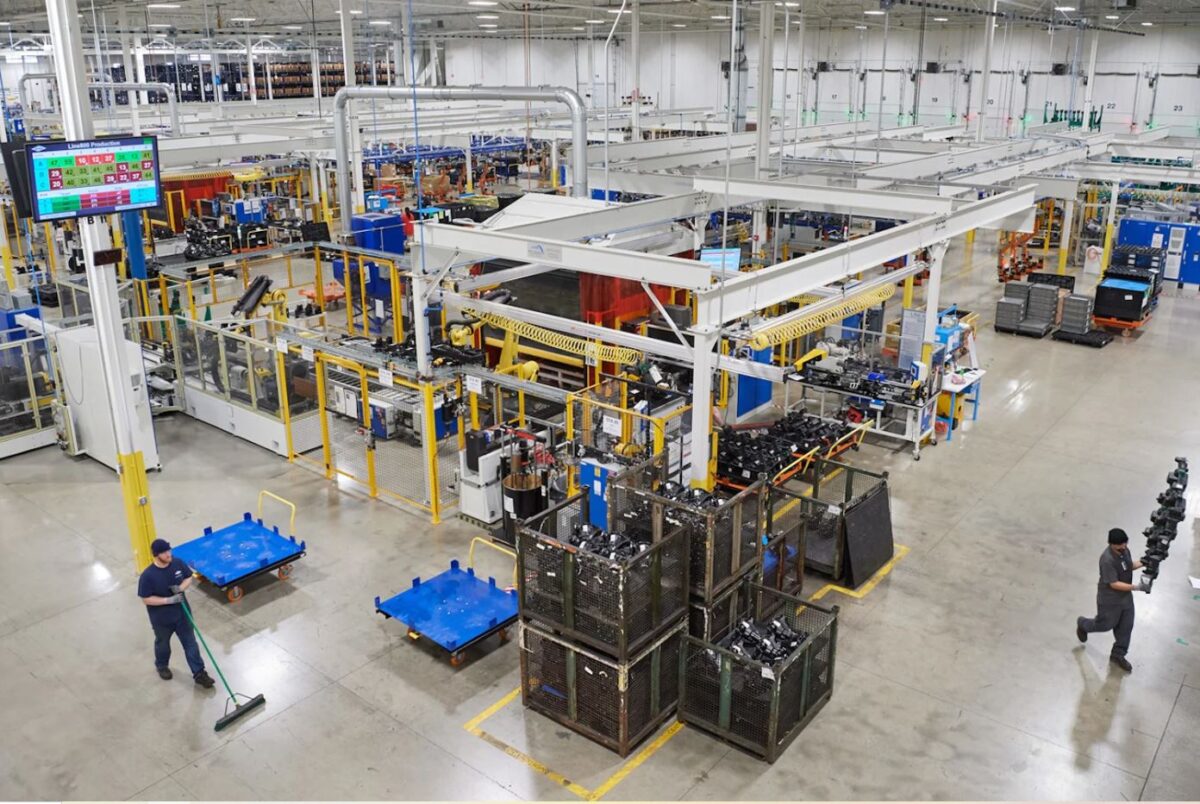
The measurement uncertainty of the supply voltage is set at 0.1% of the specified input voltage Udin over the range from 10% to 150% of Udin. It is important to note that in many cases accuracy is only specified at full scale, and while 0.1% accuracy is relatively easy to achieve, it is more difficult to achieve over this wide range.

In addition, the requirement states that measurements must be ‘continuous and non-overlapping’ over a 10/12 cycle for a 50/60 Hz electrical system. It is important to pay attention to this when looking at plant specifications, as units with a high degree of measurement uncertainty can lead to results that can be disputed by the utility or their customer.

Cheap mains power quality measurement systems, for example, often have higher levels of uncertainty when measuring at the lower end of the scale (example: measuring on a potential transformer with phase-to-neutral voltage at 58 volts). In addition, variations can also go unnoticed if measurements are not taken contiguously. These errors can lead to defective equipment being thought to be working properly when in fact it is not. With a Class A certified instrument, a technician can rest assured that measurements have been classified with internationally accepted uncertainty values. This is especially important when checking compliance with regulations or comparing results between different instruments or batches. Functional test and uncertainty requirements for Class A equipment are detailed in IEC 62586-2.

Voltage fluctuations and interruptions should be measured on a full cycle and should be updated every half cycle so that the instrument can combine the high resolution of data points sampled on a half cycle with the accuracy of RMS calculations on a full cycle. Relying solely on full-cycle calculations could misidentify valid conditions, while using only half-cycle calculations may not provide the required accuracy to fully understand any problems.

Collection periods are measurement data compressed by a mains power quality instrument at specified intervals. A Class A instrument shall display data in the following collection periods:

  • The standard time interval of measurement should be a 10/12 cycle (~200 msec) at 50/60 Hz. The interval time varies depending on the actual frequency.
  • 150/180 cycles (~3 sec) at 50/60 Hz. The interval time varies depending on the actual frequency.
  • Interval of 10 minutes synchronised with coordinated universal time (UTC)
  • Interval of 2 hours for Plt flicker

External time synchronisation is required to obtain accurate timestamps, allowing accurate correlation of data between different instruments. Accuracy is specified at ± 20 ms for 50Hz instruments and ± 16.7 ms for 60Hz instruments, regardless of the total time interval. Achieving this accuracy requires either a GPS clock via a GPS receiver or NTP (Network Time Protocol) via Ethernet. When synchronisation per an external signal is no longer available, the timing tolerance should be better than ± 1 s per 24-hour period. However, this wider tolerance is not confirmation that the measurements are Class A compliant. The lack of accurate timestamps in cheaper mains power quality instruments can make it extremely difficult to accurately troubleshoot mains power quality problems. This can lead to an inability to correctly identify the distribution of voltage events on the network when using multiple instruments.

The FFT algorithm for harmonics is precisely defined so that all Class A instruments end up with the same values of harmonics. The FFT method provides infinite algorithms that can result in very different values of harmonics, if unregulated. Class A requires harmonics to be measured with the same 10/20 cycle as the RMS measurements, according to standard Class I IEC 61000-4-7/2008, using a continuous harmonic subgroup measurement method. IEC 6100-4-7 describes several methods and algorithms for measuring harmonics, but IEC 61000-4-30 specifically mentions the Class I subgroup method.

All of these Class A requirements play an important role in providing accurate, reliable and comparable data to users, ultimately leading to better analysis and troubleshooting of mains power quality problems. With instruments that are not Class A compliant, measured results cannot be easily compared.

Conversely, Class A instruments will actually be consistent and comparable, allowing technicians to work with the confidence required to accurately analyse even the most complex grid power quality problems. For both suppliers and large energy consumers, it is important to be able to monitor incoming mains power quality and identify whether a mains power quality problem is caused inside or outside the energy consumer's premises.

Only instruments specifically designed for troubleshooting, recording and analysing mains supply parameters can provide the detailed information that allows you to pinpoint a fault source and diagnose the problem correctly. Moreover, measurements performed with Class A compliant instruments can be used in legal or contractual disputes. Therefore, it is important to choose an instrument that meets these requirements.

Fluke 1770 series three-phase Power Quality Loggers
Fluke 1738 three-phase Power Quality Loggers
Fluke 1736 three-phase Power Quality Loggers

Read more
improving the power factor

How to improve the power factor

The power factor is, simply put, the ratio of working power to apparent power, or demand power. The power factor is an expression of energy efficiency, with a higher percentage indicating more efficient energy consumption and a lower percentage indicating less efficient energy consumption. To calculate the power factor, divide the working power (kW) by the apparent power (kVA). While an efficiency of 100% may not be realistic, there are a few things that affect it, improving the power factor requires a good strategy.


Ask our experts for advice

What is the ideal power factor?

A low power factor means you are not using the energy you pay for efficiently. Lower power factors require more apparent power (kVA) to produce working power (kW). A higher power factor is better than a lower one because it means you are using energy more effectively. A common target number for the power factor is 95%. Check with your utility company what threshold they use. Many utilities charge customers if they have a low power factor.

Measuring and managing energy consumption

By the measure energy and power quality, you will get a feel for the rhythm of your installation and learn how to keep your plant running smoothly and efficiently. Strategic power management is an important way to reduce your energy consumption and your energy bill. One reason to improve your power factor is to reduce or even eliminate fines and surcharges from your utility company.

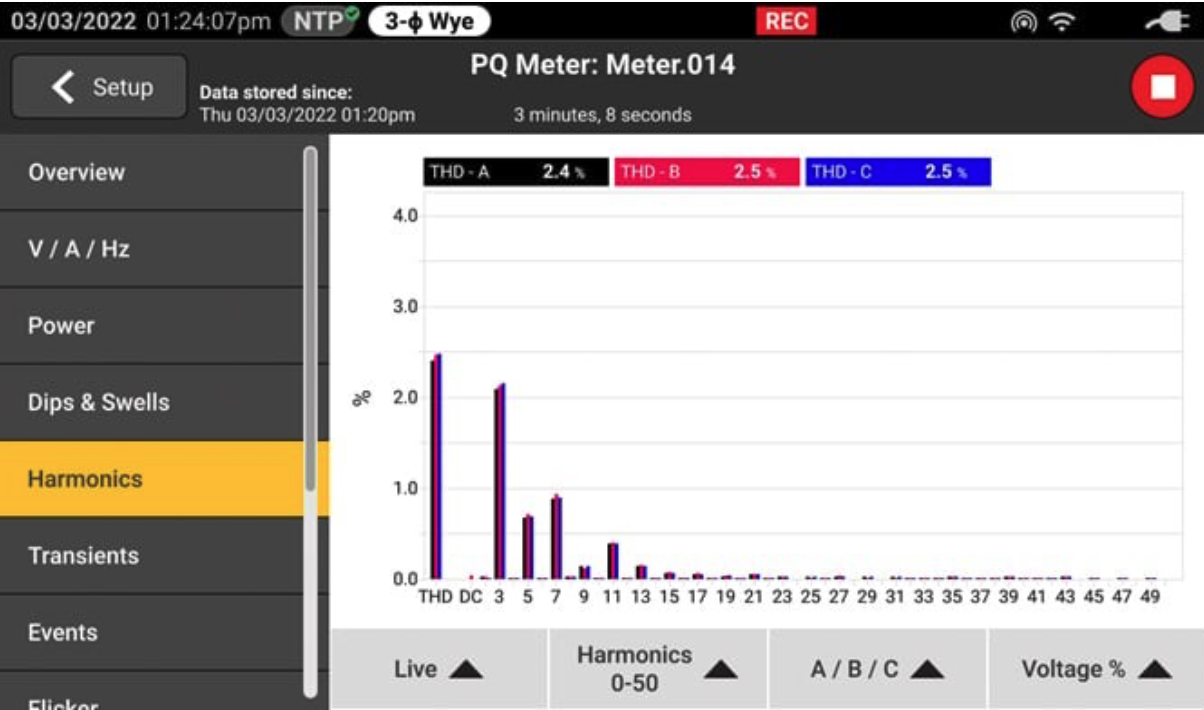
To do that, you need to know where your energy is going each month. First of all, you need to measure and record energy data from your equipment and systems. The type of instrument you need to do this depends on your facility and needs. A multifunctional tool can calculate energy losses and record high-resolution three-phase voltage and current waveforms, while another instrument can provide direct status data of mains power quality. It is important to know the level of harmonics in your power. A THD (Total Harmonic Distortion) measurement can help you figure out whether filtering is needed. And remember that a utility can only affect voltage quality. They can only require approved loads to be connected and are not responsible for the current flowing as a result of the customer's installation.

Steps to a better power factor

Motor inductance and harmonic currents are two common factors that contribute to poor power factor. To improve power factor, determine the root cause of poor power factor.

When dealing with inductive current, adding power factor correction capacitors (energy storage devices) to your plant's power distribution system is a commonly used solution. Power factor correction capacitors require regular inspection and recommended preventive maintenance, but under normal conditions they will operate trouble-free for years.

If harmonics cause the low power factor, cost-effective passive LC filtering (inductor-capacitor) is the solution.

For more complex situations, active filtering is needed. This type of filtering compensates for reactive currents, harmonic currents and unbalanced currents.

A common mistake is to use capacitors to limit harmonic currents. A capacitor behaves like a short circuit for higher harmonics. Because of the internal resistance, the capacitor will heat up and have a drastically shorter lifespan as the internal electrolyte evaporates.

Read more
diagnose mains power quality

Diagnosing mains power quality problems in older electrical systems

diagnose mains power qualityThe case of medical device failures is a classic example of the importance of a systematic approach to troubleshooting mains power quality diagnostics. This is the story of Mike, an independent contractor working with a number of high-tech factories.


The problem

Mike met on site with a building manager who was frustrated with his electrical system. According to the manager, nothing that was electrical was working as it should in the building and no one had been able to identify how this could be or could provide a solution. The administrator further told Mike that three of his electricians had quit and that he was now in real trouble.

Mike asked questions to get a more detailed picture of the problem, but the feedback did not yield much useful information. Mike liked to always follow the motto ”When in doubt, look where the casualties are” and therefore asked to go to the part of the building where the problems were most severe.

Visual hints

In one corner was a large medical machine performing a critical testing procedure. The machine was equipped with a large screen, keyboard and control panel with a number of cables and hoses leading to other pieces of equipment. The control screen displayed that the test procedure was ”In progress”.

Next to a machine was a workbench set up for repairing circuit boards. On the workbench was a soldering iron, an illuminated magnifying glass and a fan. The workbench's socket was plugged into the same socket as the large medical machine. Mike observed the person at the workbench extending his hand and turning on the fan. At that moment, the control screen on the medical machine went blank for a moment and then came back on with the words ”Programme reset” displayed in large letters.

Measuring and evaluating

Mike measured the voltage at the socket that powered both loads. His Fluke 87 V industrial multimeter measured 115 V. The building manager repeated the measurement with his Fluke 27 II Rugged digital multimeter, which displayed 118 V. Why this difference?

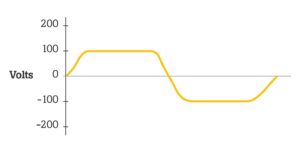
The Fluke 87 V provides True-RMS measurements that give correct but lower readings than mid-range instruments, such as the Fluke 27 II, on square waves or waveforms resembling square waves. Mike closed his Fluke 120B industrial ScopeMeter on and showed the voltage waveform. The display showed that the waveform was severely truncated at the top, making it look more like a square wave than a sine wave. The peak value measured only 135 V, instead of the expected 162 V.

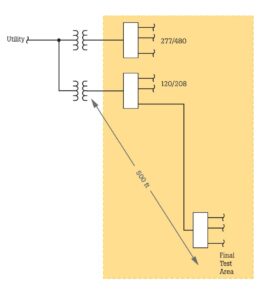
Mike drew a one-line diagram of the system. The one-line showed that the transformer supplying the test area was on the other side of the building, about 150 metres away. Most of the loads on that transformer were non-linear and reached high peak currents at the voltage peak. The combination of high peak currents and high impedance from the long distance combined to cause severe voltage drops at the end of the circuit, right at the location of the test area.

Theory and analysis

Since the internal circuits of the medical machine operated on a low DC voltage, the internal power supply would have a diode/capacitor input circuit that required a minimum peak voltage for proper functioning. The nameplate of the medical machine stated that the machine required a supply voltage between 100 and 135 V rms AC. The engineers who designed the machine and specified the nameplate assumed that the supply voltage would be a sine wave, so the minimum peak would be 141 V peak (100 x 1.41). Since the measured value of the peak voltage was only 135 V, the machine was running at a peak voltage that was already 6 V below the absolute minimum required. When the fan was switched on, the peak current energised by the fan motor reduced the voltage to a point where the machine's power supply was no longer normal. This caused the machine to reset itself.

Solution

The problem of voltage peak capping (flat topping) is common in high-tech buildings. Many of the buildings in use today are not designed to cope with the huge amount of computing and non-linear loads that are so common today.

In this case, it would be necessary to rewire everything thoroughly to reduce the voltage drop between the transformer and the load. An alternative would be to place the most sensitive loads closer to the transformer.

Read more
power consumption monitoring

5 reasons to monitor power consumption

power consumption monitoringThe ability to quantify energy consumption is essential for your plant and your team. Power consumption monitoring of your installation provides you with the data needed to make important energy management decisions.
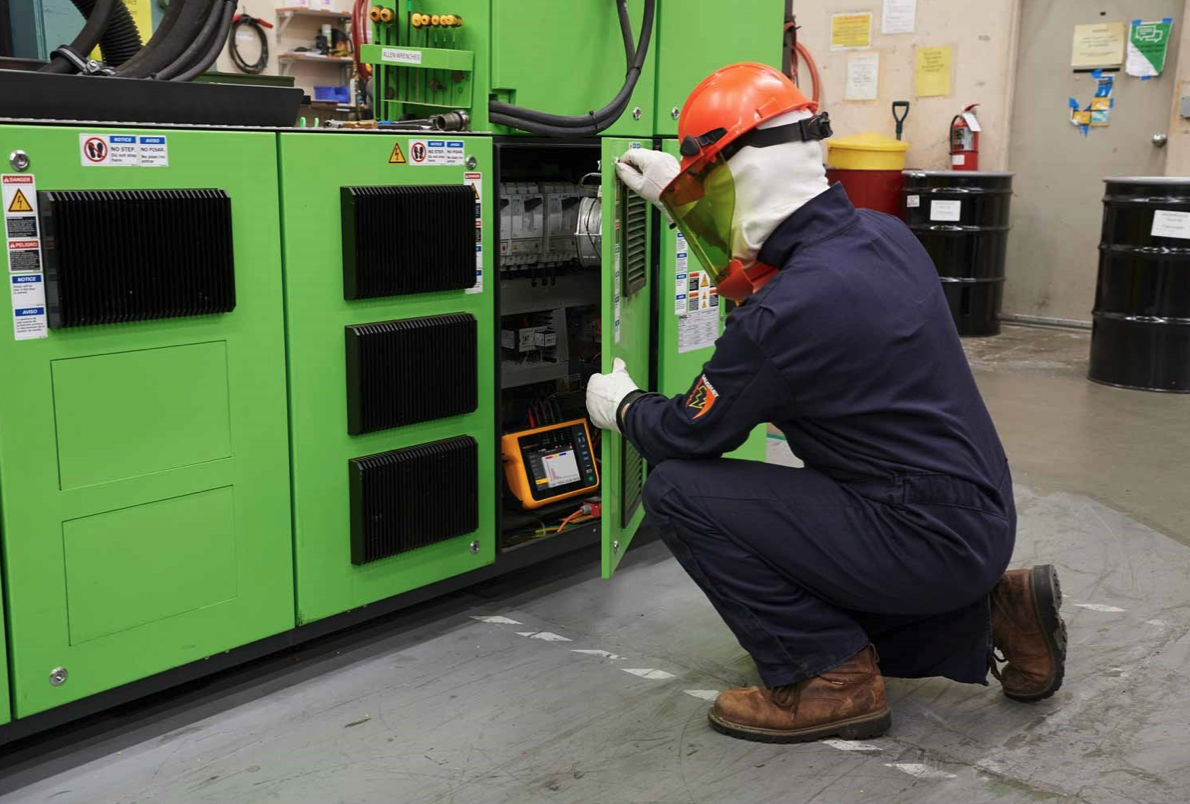
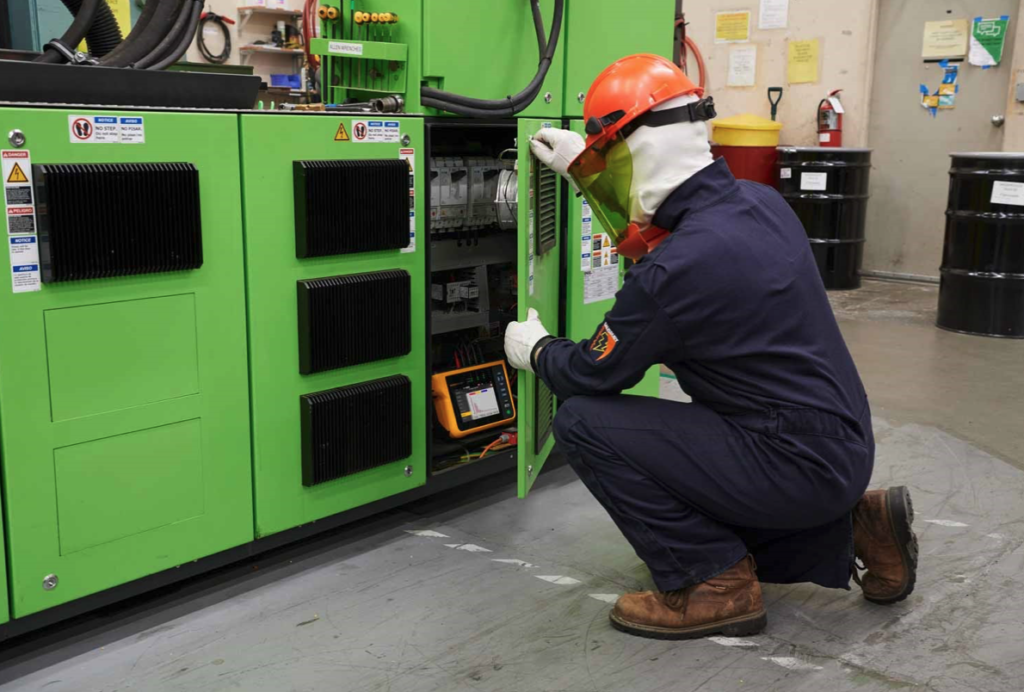
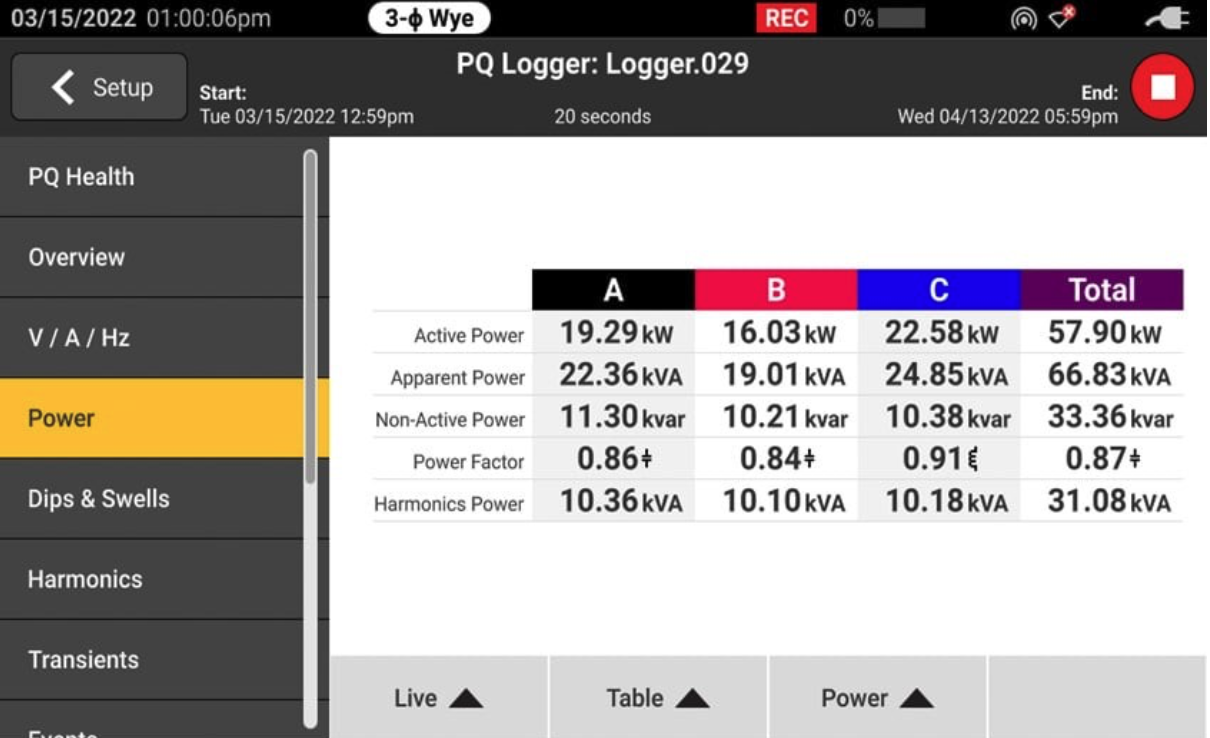
 

Why monitor power consumption with a Power Logger?

  • Understanding the capacity of your existing electrical distributor
  • Troubleshooting circuit breaker tripping problems
  • Identifying energy costs
  • Tracking energy waste


Ask our experts for advice

1. Installation safety

Electricians often have to perform a load analysis before new loads can be added to an existing panel. Why? These requirements are set by the electrical inspector, the electrical engineer who designed the project or the customer adding the new loads. The purpose is to determine whether there is sufficient capacity to add new loads.

In a load analysis, a power logger used to document existing load levels (three-phase power dissipation) over long periods of time. And this is where safety comes into play. On the one hand, load analysis can be used to ensure compliance with local safety regulations. On the other hand, failure to conduct a load analysis before adding new loads may result in the overloading of an existing electrical source or the creation of unsafe and unreliable electrical situations.

2. Managing energy costs and realising savings opportunities

Energy costs are a large part of total operational costs, and yet many companies do not have a good overview of where their energy money is going. They only get an overall monthly bill, with no indication of whether that consumption is normal or excessive for that month's operations.

By logging energy consumption at the main service input and then at large loads and secondary feeds, facilities can gain insight into how much energy is consumed when, by what and at what hourly rate. The data will actually always show energy wastage that can be corrected by changes in operations. For example, consider switching off certain loads, reducing loads during periods of high tariffs, or adjusting the schedule so that loads are operational during periods of off-peak tariffs.


Schedule a consultation

3. Electricity bill accuracy

Owners of large and medium-sized facilities often install submeters so they can bill tenants for their specific electricity consumption. However, these submeters are usually installed incorrectly, resulting in unreliable data. Installation problems range from power inverters placed incorrectly and power inverters on the wrong phase, to errors in submeter configuration.

A good practice is to check the measured value with a portable energy logger. The logger data provides an order-of-magnitude comparison of what is charged with what is consumed. A significant difference between the energy consumption charged and the logger data indicates that the submeter setting should be investigated.

4. Rebates and financial incentives

Utilities offer premiums and rebates to encourage their customers to reduce their energy consumption. The aim is to serve more customers with the same current energy supply, as building new power plants is not an option. Many premiums and rebates are aimed at retrofitting existing buildings, with energy-efficient lighting and high-efficiency motors, for example, or replacing motor starters with frequency-controlled drives.

To grant the financial incentive bonus, the utility first requires proof of energy savings - and for this, a load analysis is ideal. A load analysis performed before a retrofit identifies the current energy consumption for reference, a load analysis after a retrofit confirms the energy savings achieved by the retrofit.

5. Detecting problems with mains power quality

Often, the only way to solve a problem is to record and analyse data over a long period of time. For these more complex problems, energy loggers are invaluable, and they are much more affordable and easier to use than a complicated Power Analyzer.

A good example is when a circuit breaker trips randomly. Obvious situations, such as a heavy motor starting, are not always the cause. In reality, the cause of the tripping may be something that does not seem obvious, or may only occur when technicians are not present to notice it (e.g. at night). Having a maintenance technician monitor the load until the circuit breaker trips is impractical. Connecting an energy logger to the load side of the circuit breaker to record the current draw for an extended period of time can then help to solve the problem.

Read more
power supply quality

Detecting energy waste by managing grid power quality

power supply qualitySaving energy and minimising energy waste are important aspects of energy consumption. If you want to save energy, you need to identify your energy consumption and develop an energy saving plan for power quality management, regardless of the sector you work in.


Benchmarking electrical energy consumption

The first step in developing a power quality management programme is to benchmark your current electrical energy consumption in the plant. In doing so, look for quick and easy solutions, such as areas that are typically closed on weekends and can be switched off. Track areas that contribute to your energy consumption outside major assets, such as extra electric heating, lights that are still on and computers that are not switched off.

Once you have identified and implemented these quick wins, conduct more detailed analyses in the building or on campus. Perform load analyses on assets across the area with theFluke 1777 three-phase Power Quality Analyzer. These measurements may show where significant energy savings can be made, for example by switching off certain systems at night when they are not in use.

Advanced power quality considerations

When power flows, some of the energy generated is inevitably lost in the form of heat.

The next step in reducing your energy consumption is to identify where energy wastage occurs. One area of concern is losses in conductors. When current flows through conductors, some of the energy generated is wasted as heat. If you want to solve this problem, apply the fundamental I2R equation indicating the current supplied. There are 2 possible solutions here: lower the current (I) for less kW or lower the resistance (R). Both create a problem:

  • At a lower current (I), the load does not operate correctly
  • Reducing resistance (R) may cost more, as copper or aluminium conductors need to be installed


So what is the best solution?

Consider the size of the conductor. In the National Electric Code (NFPA 70 or NEC 100) you will find a lot of advice on the size of a conductor and the ideal conductor size is described for almost all circumstances. The main consideration for the size of conductors is to ensure their safe operation with the most suitable insulation. The length, cross-sectional area and rated current expected to be required are decisive here. This will ensure minimal energy losses, typically 2% or less, and an acceptable voltage drop in the conductor. Another option is to install more efficient loads. Check whether the motors might be oversized for the current application.

Energy waste

These codes and guidelines are useful for new work, but once cabling is in place and loads are installed, the result is not always optimal. Over time, equipment can change due to additions, modifications, moves and age. This can have a major effect on energy waste. Key areas where energy waste can occur are related to your mains power quality: voltage regulation, harmonics, power factor and asymmetric loads.


Schedule a consultation

Voltage regulation

Voltage regulation aims to reduce energy consumption in loads that are voltage dependent. This is done by reducing or regulating voltage levels within the equipment manufacturer's specifications to yield energy savings. As more efficient loads are installed on a transformer, the voltage in the system may increase or be misregulated.

Use a Fluke 1777 Power Quality Analyzer to identify voltage regulation problems and detect transient voltages and voltage imbalances. Both problems can lead to failures, unplanned downtime and costly repairs.

power quality managementHarmonischen

Harmonics distort voltage and current so that the ideal sine wave for voltage is not maintained. One of the most well-known effects of harmonics in electrical systems is the excessive heat they cause in conductors. This results in overheating in phase and neutral conductors, known as ‘triple harmonics.’

The extra heat causes problems in wiring, motor windings and transformers. The overheating can cause significant damage or catastrophic failure, resulting in unscheduled downtime and expensive repairs. To measure and diagnose harmonics, use aFluke 1770 series three-phase Power Quality Analyzer.

Benefits of power quality analysis

If, after power quality analyses, it is visible where energy is being wasted, you can take steps to solve the problems:

  1. Perform preventive maintenance routinely so you can continue to measure against your benchmark and address problems as soon as they arise.
  2. Install harmonic filters on loads that increase the harmonic distortion of your installation.
  3. Address the causes of imbalance. This may mean setting up a repair or replacement schedule for large engines that have problems with mechanical imbalance.
  4. Limit problems caused by asymmetrical loads. In some cases, this may mean adjusting single-phase loads to distribute them more evenly between phases.
  5. Replace blown fuses if necessary. A blown fuse on a group of three-phase power factor upgrade capacitors may also be the cause of the problem; replacing the fuse may solve a major imbalance.

Mains power quality analyses show what can be done to save energy, reduce energy losses due to problems in an installation and reduce energy costs. Monitoring mains power quality can provide insight into the cause of problems and how to solve them.

Mains power quality analyses provide some other benefits besides energy savings:

  • Discovery vhan potential weaknesses in assets that could cause a major disruption
  • Discovery of equipment failures that could lead to worsening problems
  • Discovery of improperly installed circuit breakers prone to inadvertent tripping
Read more
compressed air, gas and vacuum leaks

This is how you detect compressed air, gas and vacuum leaks AND find hidden profits

Fluke Sonic air leak detectorFor industrial plants, compressed air, gas and vacuum systems are an essential source of converted energy. Compressors are simpler than other sources of energy such as electricity and they are everywhere in today's factories. They power machines, tools, robots, lasers, product handling systems and much more.

Yet many compressed air, gas and vacuum systems suffer from wear and poor maintenance, contributing to the biggest waste of all: ever-present leaks. These leaks may be hidden behind machinery or located at connection points, in fixed overhead lines or in cracked pipes or worn hoses. The waste increases rapidly and can even lead to downtime.


Ask our experts for advice

Detecting and fixing leaks is not easy

Many factories and plants do not have a leak detection programme. Detecting and fixing compressed air, gas and vacuum leaks is not easy. Quantifying the amount of waste and determining the cost requires energy specialists or consultants who use energy analysers and loggers to monitor your air systems. By systematically calculating the annual cost savings from fixing leaks, they can make a strong business case for undertaking such a project.

Energy audits of compressed air systems are often carried out through partnerships of industry, government and non-governmental organisations (NGOs). One such partnership is the Compressed Air Challenge (CAC), a voluntary collaboration between these groups. Its sole purpose is to provide product-neutral information and educational materials to help industries generate and use compressed air with maximum sustainable efficiency.

The high cost of wasted air

According to the U.S. Department of Energy, a 1/8″ (3 mm) leak in a compressed air line can cost more than $2,500 a year. The Department of Energy estimates that an average US plant that is not properly maintained can waste 20% of its total compressed air production capacity due to compressed air, gas and vacuum leaks. The New Zealand government, as part of its Target Sustainability project, estimates that system leaks can account for 30 to 50% of a compressed air system's capacity. Rapid detection of compressed air, gas and vacuum leaks is a key factor in finding hidden profits. Air leaks can also lead to capital expenditure, rework, downtime or quality problems and higher maintenance costs.

To compensate for pressure loss due to leaks, business managers often tend to overcompensate by purchasing a larger compressor than necessary, which incurs significant capital costs and higher energy costs. System leaks can also lead to air equipment failure due to low system pressure. This can lead to production delays, unplanned downtime, quality problems, shorter lifespan and increased maintenance due to unnecessary switching compressors on and off.

For example, the maintenance manager of a manufacturer in the US says that low pressure in one of their air tools can lead to defects in their products. “Incorrect torque, either too low torque or too high torque, can result in recalls. This also leads to more man-hours in something that should be a very standard process,” he says. “It is throwing money down the drain through loss of profits and loss of products. At worst, demand may also be at risk because we could not deliver.”

It is no wonder that utilities, industry and government see compressed air systems as a potential source of cost savings. Compressed air, gas and vacuum leaks lead to waste. Fixing such leaks can save the company manager money and prevent the utility from having to build additional capacity into the system.


Schedule a consultation

Why ultrasonic leak detection is inefficient

Unfortunately, the most common leak detection practices are rather primitive. An old-fashioned method is to listen for hissing sounds, which are almost impossible to hear in many environments, and spray soapy water on the area of the suspected leak, which is messy and could potentially be a slip hazard.
The current tool for detecting compressor leaks is a ultrasound detector, a portable electronic device that recognises high-frequency sounds related to air leaks. Typical ultrasonic detectors help find leaks, but their use is time-consuming and repair staff can usually only use them during scheduled downtime, while servicing other critical machinery may be a better use of time. These instruments also require the operator to be close to the equipment to find leaks, making the instruments difficult to use in hard-to-reach places such as ceilings or behind other equipment.

In addition to the time required to detect leaks with suds or ultrasonic detectors, there may be safety issues with these techniques related to finding leaks above or below equipment. Climbing ladders or crawling around equipment can be hazardous.

Pioneering for compressed air leak detection

What if there was a leak detection technology that could determine the exact location of a leak up to 50 metres away, in a noisy environment, without having to turn off equipment? Fluke has developed an industrial acoustic camera that does just that. Industrial maintenance managers call the Fluke ii900 Sonic Industrial Imager“Pioneering” for compressed air leak detection.

Capable of detecting a wider frequency range than traditional ultrasonic devices, this new acoustic industrial camera uses new SoundSight™ technology to provide enhanced visual scans of air leaks, just as thermal imaging cameras detect hotspots.

The ii900 features an acoustic array of small, super-sensitive microphones that detect both sonic and ultrasonic sound waves. The ii900 recognises a sound source at a potential leak location and then applies algorithms that interpret the sound as a leak. The results produce a SoundMap™ image, a colour map overlaid on top of the visible-light image, - showing exactly where the leak is. The results are displayed on the 7-inch LCD screen as a still image or real-time video. The ii900 can store up to 999 image files or 20 video files for documentation or compliance.

Large areas can be scanned quickly, detecting leaks much faster than other methods. Filtering can also be done by intensity and frequency ranges. A team at a large factory recently used two ii900 prototypes and detected 80 compressed air leaks in one day. The maintenance manager said that using traditional methods it would have taken weeks to find that number of leaks. By quickly detecting and fixing leaks, the crew also avoided potential downtime, which can cost an estimated $100,000 an hour in lost productivity at this plant.

Where to find leaks:

  • Links
  • Snakes
  • Tubes
  • Fittings
  • Threaded pipe connections
  • Shortcuts
  • FRLs (combinations of filter, regulator and lubricator)
  • Condensate traps
  • Valves
  • Flanges
  • Gaskets
  • Air supply boilers

How much air do you waste?

The first step in controlling leaks in compressed air, gas and vacuum systems is to estimate the leakage rate. Some leakage (less than 10%) is to be expected. Anything more is considered wastage. The first step is to determine your current leakage load so that you can use it as a benchmark against which to compare improvements.

The best method for estimating leakage load is based on your control system. If you have a system with start/stop control, simply start your compressor when there is no demand in the system - after working hours or shifts. Then measure a number of compressor cycles to determine the average time before the loaded system is unloaded. If there is no equipment in operation, the unloading of the system is due to leakage.

Leakage (%) = (T x 100) ÷ (T + t)T = load time (minutes), t = relief time (minutes)

To estimate the leakage load in systems with more complex control strategies, place a pressure gauge downstream of the volume (V, in cubic metres), including all secondary boilers, mains and pipes. If there is no demand in the system, except for leakage, bring the system to normal working pressure (P1, in psig). Select a second pressure (P2, about half the value of P1) and measure the time (T, in minutes) it takes the system to drop to P2.

Leakage (cfm free air) = [(V x ( P1 - P2) ÷ (T x 14.7)] x 1.25

The multiplier 1.25 corrects leakage to normal system pressure, taking into account lower leakage as system pressure decreases.

Efficiently fixing and repairing leaks can lead to significant cost savings for air-dependent businesses. Companies can not only save on energy consumption by repairing leaks, but can also improve production and extend the life of equipment.

Read more

Need advice?

Contact our product specialist Thiara for help in choosing the right instrument.
Contact Thiara