Fluke MDA-550 Series III Motor Drive Analyzer

Producer: Fluke

Key features

  • Guided tests with graphical, step-by-step connection diagrams
  • Preset measurement profiles reduce set-up complexity
  • Built-in functions for writing reports
  • Easily produce fault-finding reports of the situation before and after the event

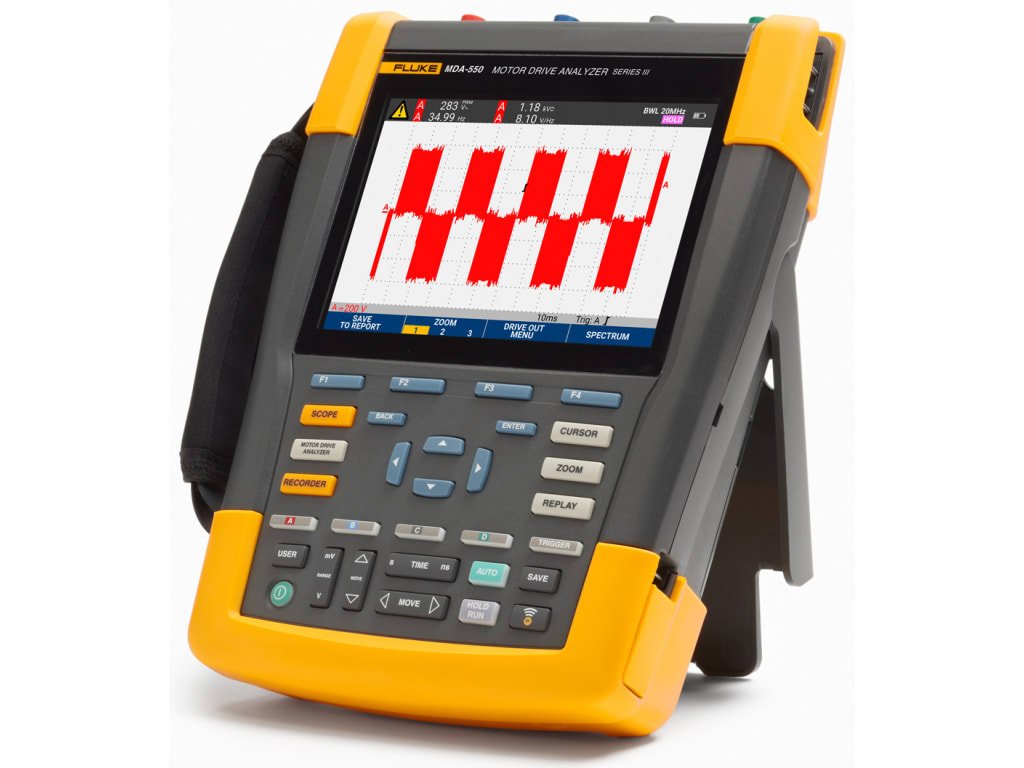
Make complex troubleshooting of motor drives simple. With guided test setups and automated measurements on drives that produce reliable, repeatable test results.

The Fluke MDA 550 Motor Drive Analyzer saves you time. You no longer need to set up complex measurements and motor drive troubleshooting becomes much easier. Simply select a test and the step-by-step guided measurements show you where to make voltage and current connections. In addition, preset measurement profiles ensure that you record all the data you need for each critical part of the motor drive, from input to output, the DC bus and the motor itself. From simple to advanced measurements, the MDA-550 lets you handle it all. And with a built-in report generator, you can produce reliable before/after reports quickly and easily.

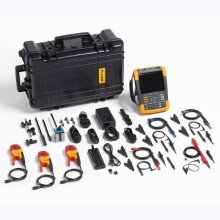
The MDA-550 is the ideal portable instrument for analysing motor drives. It helps you detect and fix common inverter motor drive problems.

  • Measure key parameters for motor drives such as voltage, current, DC bus voltage level and AC ripple, voltage and current unbalance and harmonics, voltage modulation and voltage discharges through the motor shaft.
  • Perform comprehensive measurements of harmonics to identify the effects of low and high harmonics on your electrical system.
  • Perform guided measurements to the motor drive input, DC bus, drive output, motor input and motor shaft with graphic, step-by-step wiring diagrams for voltage and current.
  • Use a simplified measurement setup with preset measurement profiles to automatically trigger data collection based on the selected measurement procedure.
  • Create reports quickly and easily which are perfect for documenting troubleshooting and collaborating with others.
  • Measure additional electrical parameters with a full-fledged 500 MHz oscilloscope, metering and recording function for a complete range of electrical and electronic measurements on industrial systems.

The Fluke MDA-550 Motor Drive Analyzer uses guided test measurements to make analysis easier than ever

Drive input

Measure the input voltage and current to quickly see if values are within acceptable limits by comparing the rated voltage of the drive with the actual supply voltage. Then check the input current to determine whether the current does not exceed the maximum value and the conductors are sufficiently sized. You can also check whether the harmonic distortion is within acceptable levels by visually checking the shape of the waveform or by viewing the harmonic spectrum screen, which shows both the total harmonic distortion and the individual harmonics.

Voltage and current unbalance

Check voltage unbalance at the inputs to make sure phase unbalance is not too high (> 6-8%) and that phase rotation is correct. You can also check for current unbalance, as excessive unbalance may indicate a problem with the drive rectifier.

Comprehensive measurements of harmonics

Excessive harmonics are a threat not only to your rotating machinery but also to other equipment connected to the electrical system. With the MDA-550, you can look for the harmonics of the motor drive but also discover the possible effects of the inverter's switching electronics. The MDA-550 has three ranges for harmonics, from the 1st to the 51st harmonic, from 1 to 9 kHz and from 9 kHz to 150 kHz, so you can detect any problem related to harmonic contamination.

DC bus

In a motor drive, converting AC to DC in the drive is critical, as the correct voltage and adequate smoothing with low ripple is needed for the best performance of the drive. A high ripple voltage can be an indication of faulty capacitors or incorrect measurement of the connected motor. The record function can be used to monitor the performance of the DC bus dynamically in operating mode while a load is on.

Drive output

Check the output of the drive in terms of both voltage-to-frequency (V/F) ratio and voltage modulation. At high readings of the V/F ratio, the motor may overheat. At low readings of the V/F ratio, the connected motor may not be able to deliver the required torque for the load to adequately perform the intended process.

Voltage modulation

Measurements of the pulse-width modulated signal are used to check for high voltage spikes that can damage the insulation of motor windings. The rise time or steepness of pulses is indicated by the dV/dt value (the rate of voltage change over time). This should be compared with the specified insulation of the motor. The measurements can also be used to measure the switching frequency to determine if there is a possible problem with electronic circuitry, or with grounding, where the signal rises and falls.

Motor input

Ensuring the voltage supply to the motor input is essential, and the choice of cabling from the drive to the motor is critical. An incorrect choice of cabling can lead to damage to both the drive and motor due to excessive reflected voltage spikes. It is important to check that the current at the connections is within the motor specification, as overcurrent can lead to overheating of the motor, which can shorten the life of the stator insulation and therefore cause premature motor failure.

Motor shaft voltage

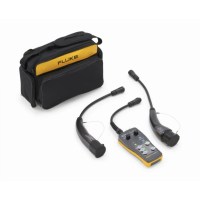
Voltage pulses from a frequency-controlled drive can be induced by the stator of an electric motor into the rotor of the motor, leading to an electrical voltage in the rotor shaft. If this rotor shaft voltage is higher than the insulating capacity of the bearing grease, arcing can occur, leading to pitting and grooving in the motor bearing raceway: damage that can cause a motor to fail prematurely. The MDA-550 comes with carbon brush measuring pins that easily detect the presence of destructive spark currents, while the impulse amplitude and event count allow you to take action before failure occurs. By using this accessory, you can detect potential damage without investing in expensive permanently installed solutions.

Step-by-step guided measurements ensure you have the data you need, when you need it

The MDA-550 is designed to help you quickly and easily test and troubleshoot typical problems on three-phase and single-phase inverter motor drives. Thanks to the on-screen information and step-by-step guidance, you can easily configure the analyser and take measurements on the drive to quickly make better maintenance decisions. From the power supply to the installed motor, the MDA-550 provides the measurement capabilities for the fastest troubleshooting of motor drives.

  • Drive input step-by-step guided measurement connections

    Drive input step-by-step guided measurement connections

Specifications: Fluke MDA-550 Series III Motor Drive Analyzer

Combinations of measurement and analysis functions
Measuring point Subgroup Readout 1 Readout 2 Readout 3 Readout 4
Input of motor drive
Voltage and current
Phase-phase V-A-Hz V ac+dc A ac+dc Hz
V peak V peak max V peak min V pk-to-pk Crest factor
A peak A peak max A peak min A pk-to-pk Crest factor
Phase-earth V-A-Hz V ac+dc A ac+dc Hz
V peak V peak max V peak min V pk-to-pk Crest factor
A peak A peak max A peak min A pk-to-pk Crest factor
Tension imbalance Imbalance V ac+dc V ac+dc V ac+dc Imbalance
Peak V pk-to-pk V pk-to-pk V pk-to-pk
Current imbalance Imbalance A ac+dc A ac+dc A ac+dc Imbalance
Peak A pk-to-pk A pk-to-pk A pk-to-pk
DC bus of motor drive
DC V dc V pk-to-pk V peak max
Wrinkle V ac V pk-to-pk Hz
Output of motor drive
Voltage and current (filtered) V-A-Hz V PWM A ac+dc Hz V/Hz
V peak V peak max V peak min V pk-to-pk Crest factor
A peak A peak max A peak min A pk-to-pk Crest factor
Tension imbalance Imbalance V PWM V PWM V PWM Imbalance
Peak V pk-to-pk V pk-to-pk V pk-to-pk
Current imbalance Imbalance A ac+dc A ac+dc A ac+dc Imbalance
Peak A pk-to-pk A pk-to-pk A pk-to-pk
Voltage modulation
Phase-phase Zoom 1 V PWM V pk-to-pk Hz V/Hz
Zoom 2 V peak max V peak min Delta V
Zoom 3 peak V peak max Delta V/s Peak rise time Overshoot
Zoom 3 level Delta V Delta V/s Level rise time Overshoot
Phase-earth Zoom 1 V PWM V pk-to-pk V peak max V peak min
Zoom 2 V peak max V peak min Delta V Hz
Zoom 3 peak V peak max Delta V/s Peak rise time Overshoot
Zoom 3 level Delta V Delta V/s Level rise time Overshoot
Phase DC + Zoom 1 V PWM V pk-to-pk V peak max V peak min
Zoom 2 V peak max V peak min Delta V Hz
Zoom 3 peak V peak max Delta V/s Peak rise time Overshoot
Zoom 3 level Delta V Delta V/s Level rise time Overshoot
Phase DC - Zoom 1 V PWM V pk-to-pk V peak max V peak min
Zoom 2 V peak max V peak min Delta V Hz
Zoom 3 peak V peak max Delta V/s Peak rise time Overshoot
Zoom 3 level Delta V Delta V/s Level rise time Overshoot
Motor input
Voltage and current (filtered) V-A-Hz V PWM A ac+dc Hz V/Hz
V peak V peak max V peak min V pk-to-pk Crest factor
A peak A peak max A peak min A pk-to-pk Crest factor
Tension imbalance Imbalance V PWM V PWM V PWM Imbalance
Peak V pk-to-pk V pk-to-pk V pk-to-pk
Current imbalance Imbalance A ac+dc A ac+dc A ac+dc Imbalance
Peak A pk-to-pk A pk-to-pk A pk-to-pk
Voltage modulation
Phase-phase Zoom 1 V PWM V pk-to-pk Hz V/Hz
Zoom 2 V peak max V peak min Delta V
Zoom 3 peak V peak max Delta V/s Peak rise time Overshoot
Zoom 3 level Delta V Delta V/s Level rise time Overshoot
Phase-earth Zoom 1 V PWM V pk-to-pk V peak max V peak min
Zoom 2 V peak max V peak min Delta V Hz
Zoom 3 peak V peak max Delta V/s Peak rise time Overshoot
Zoom 3 level Delta V Delta V/s Level rise time Overshoot
Motor shaft
Axis tension Events from V pk-to-pk
Events to Delta V Rise/fall time Delta V/s Events/s
Input and output of motor drive and motor input
Harmonischen Tension V ac Base voltage Ground frequency % THD
Current A AC Basic stream Ground frequency % THD/TDD
Measurement function Specification
DC voltage (V DC)
Maximum voltage with probe 10:1 or 100:1 1000 V
Maximum resolution with probe 10:1 or 100:1 (voltage to earth) 1mV / 10mV
Scale end value 999 counts
Accuracy 4 s to 10 µs/div ± (1.5 % + 6 counts)
True RMS voltage (V AC or V AC + DC) (with DC coupling selected)
Maximum voltage with probe 10:1 or 100:1 (voltage to earth) 1000 V
Maximum resolution with probe 10:1 or 100:1 1 mv / 10 mV
Scale end value 999 counts
DC up to 60 Hz ± (1.5 % + 10 counts)
60 Hz to 20 kHz ± (2.5 % + 15 counts)
20 kHz to 1 MHz ± (5 % + 20 counts)
1 MHz to 25 MHz ± (10% + 20 counts)
PWM voltage (V pwm)
Target For measuring pulse-width modulated signals, such as output signals of frequency converters of motor drives
Principle Readouts show the effective voltage based on the average value of samples over a whole number of periods of the fundamental frequency
Accuracy As V AC+DC for sinusoidal signals
Peak voltage (V-peak)
Modi Max peak value, min peak value or peak-peak value
Maximum voltage with probe 10:1 or 100:1 (voltage to earth) 1000 V
Maximum resolution with probe 10:1 or 100:1 10 mV
Accuracy
Max peak, min peak ± 0.2 division
Pk-pk ± 0.4 division
Scale end value 800 counts
Current (AMP) with current clamp
Reach Same as V AC, V AC+DC or V peak
Scale factors 0.1 mV/A, 1 mV/A, 10 mV/A, 20 mV/A, 50 mV/A, 100 mV/A, 200 mV/A, 400 mV/A
Accuracy Same as V AC, V AC+DC or V peak (add current clamp accuracy)
Frequency (Hz)
Reach 1,000 Hz to 500 MHz
Scale end value 9999 counts
Accuracy ± (0.5% + 2 counts)
Volt/hertz ratio (V/Hz)
Target Display of the measured V PWM value (see V PWM) divided by the fundamental frequency for frequency-controlled AC drives
Accuracy % Vrms + % Hz
Voltage unbalance input drive
Target Display of the largest percentage difference of one of the phases compared to the average of the 3 True RMS voltages
Accuracy Indicative rate based on V AC+DC values
Voltage imbalance between drive output and motor input
Target Display of the largest percentage difference of one of the phases compared to the average of the 3 PWM voltages
Accuracy Indicative rate based on V PWM values
Current unbalance drive input
Target Display of the largest percentage difference of one of the phases compared to the average of the 3 AC current values
Accuracy Indicative percentage based on A AC+DC values
Current imbalance between drive output and motor input
Target Display of the largest percentage difference of one of the phases compared to the average of the 3 AC current values
Accuracy Indicative rate based on A AC values
Ascent and descent time
Readouts Voltage difference (dV), time difference (dt), voltage versus time difference (dV/dt), overshoot
Accuracy As accuracy at oscilloscope
Harmonics and spectrum
Harmonischen DC to 51st
Spectrum ranges 1-9 kHz, 9-150 kHz (20 MHz filter on), up to 500 MHz (voltage modulation)
Axis tension
Events/second Indicative rate based on measurements of rise and fall time (pulse discharges)
Report data recording
Number of screenshots Normally 50 screenshots can be stored in reports (depending on compression ratio)
Transfer to PC Using a 32GB USB stick or a smaller one of 2GB or a mini-USB-to-USB cable or Wi-Fi link and FlukeView™ 2 for ScopeMeter®
Probe settings
Voltage measuring probe 1:1, 10:1, 100:1, 1000:1, 20:1, 200:1
Current clamp 0.1 mV/A, 1 mV/A, 10 mV/A, 20 mV/A, 50 mV/A, 100 mV/A, 200 mV/A, 400 mV/A
Asspanningsprobe 1:1, 10:1, 100:1
Safety
General IEC 61010-1: Pollution degree 2
Measurement Measurement IEC 61010-2-030: CAT IV 600 V/CAT III 1000 V
Maximum voltage between any connection and earth 1000 V
Max. input voltages Via VPS410-II or VPS421 1000 V CAT III / 600 V CAT IV
BNC input A, B, C, D direct 300 V CAT IV
Max. suspended voltage, measuring instrument or measuring instrument with VPS410-II / VPS421 voltage measuring probe From any connection to earthing 1000 V CAT III / 600 V CAT IV Between any connection 1000 V CAT III / 600 V CAT IV
Operating voltage between measuring pin and probe reference lead VPS410-II: 1000 V
VPS421: 2000 V

Download datasheet

Need advice?

Contact our product specialist Thiara for help in choosing the right instrument.
Contact Thiara

Select at least 2 products
to compare